demo-app / dashboards
curated operational views for monitoring, audits, control-plane and Mac
back to demo open /control-plane
appdemo-app
envprod
status?
time--:--:--

Operational dashboards

Public-safe dashboard gallery for the monitoring stack. Screenshots are grouped by the questions they answer: is the control-plane healthy, are audits clean, is the demo app behaving, and is the Mac agent alive.
domains
4 audits
workflow
AI review
runtime
Grafana
surface
safe preview

Primary views

Start here during normal operation or after an alert.

Control Plane Overview

Pipeline health, queue depth, decisions, tasks and runs.
featured orchestration control-plane
Control Plane Overview dashboard preview
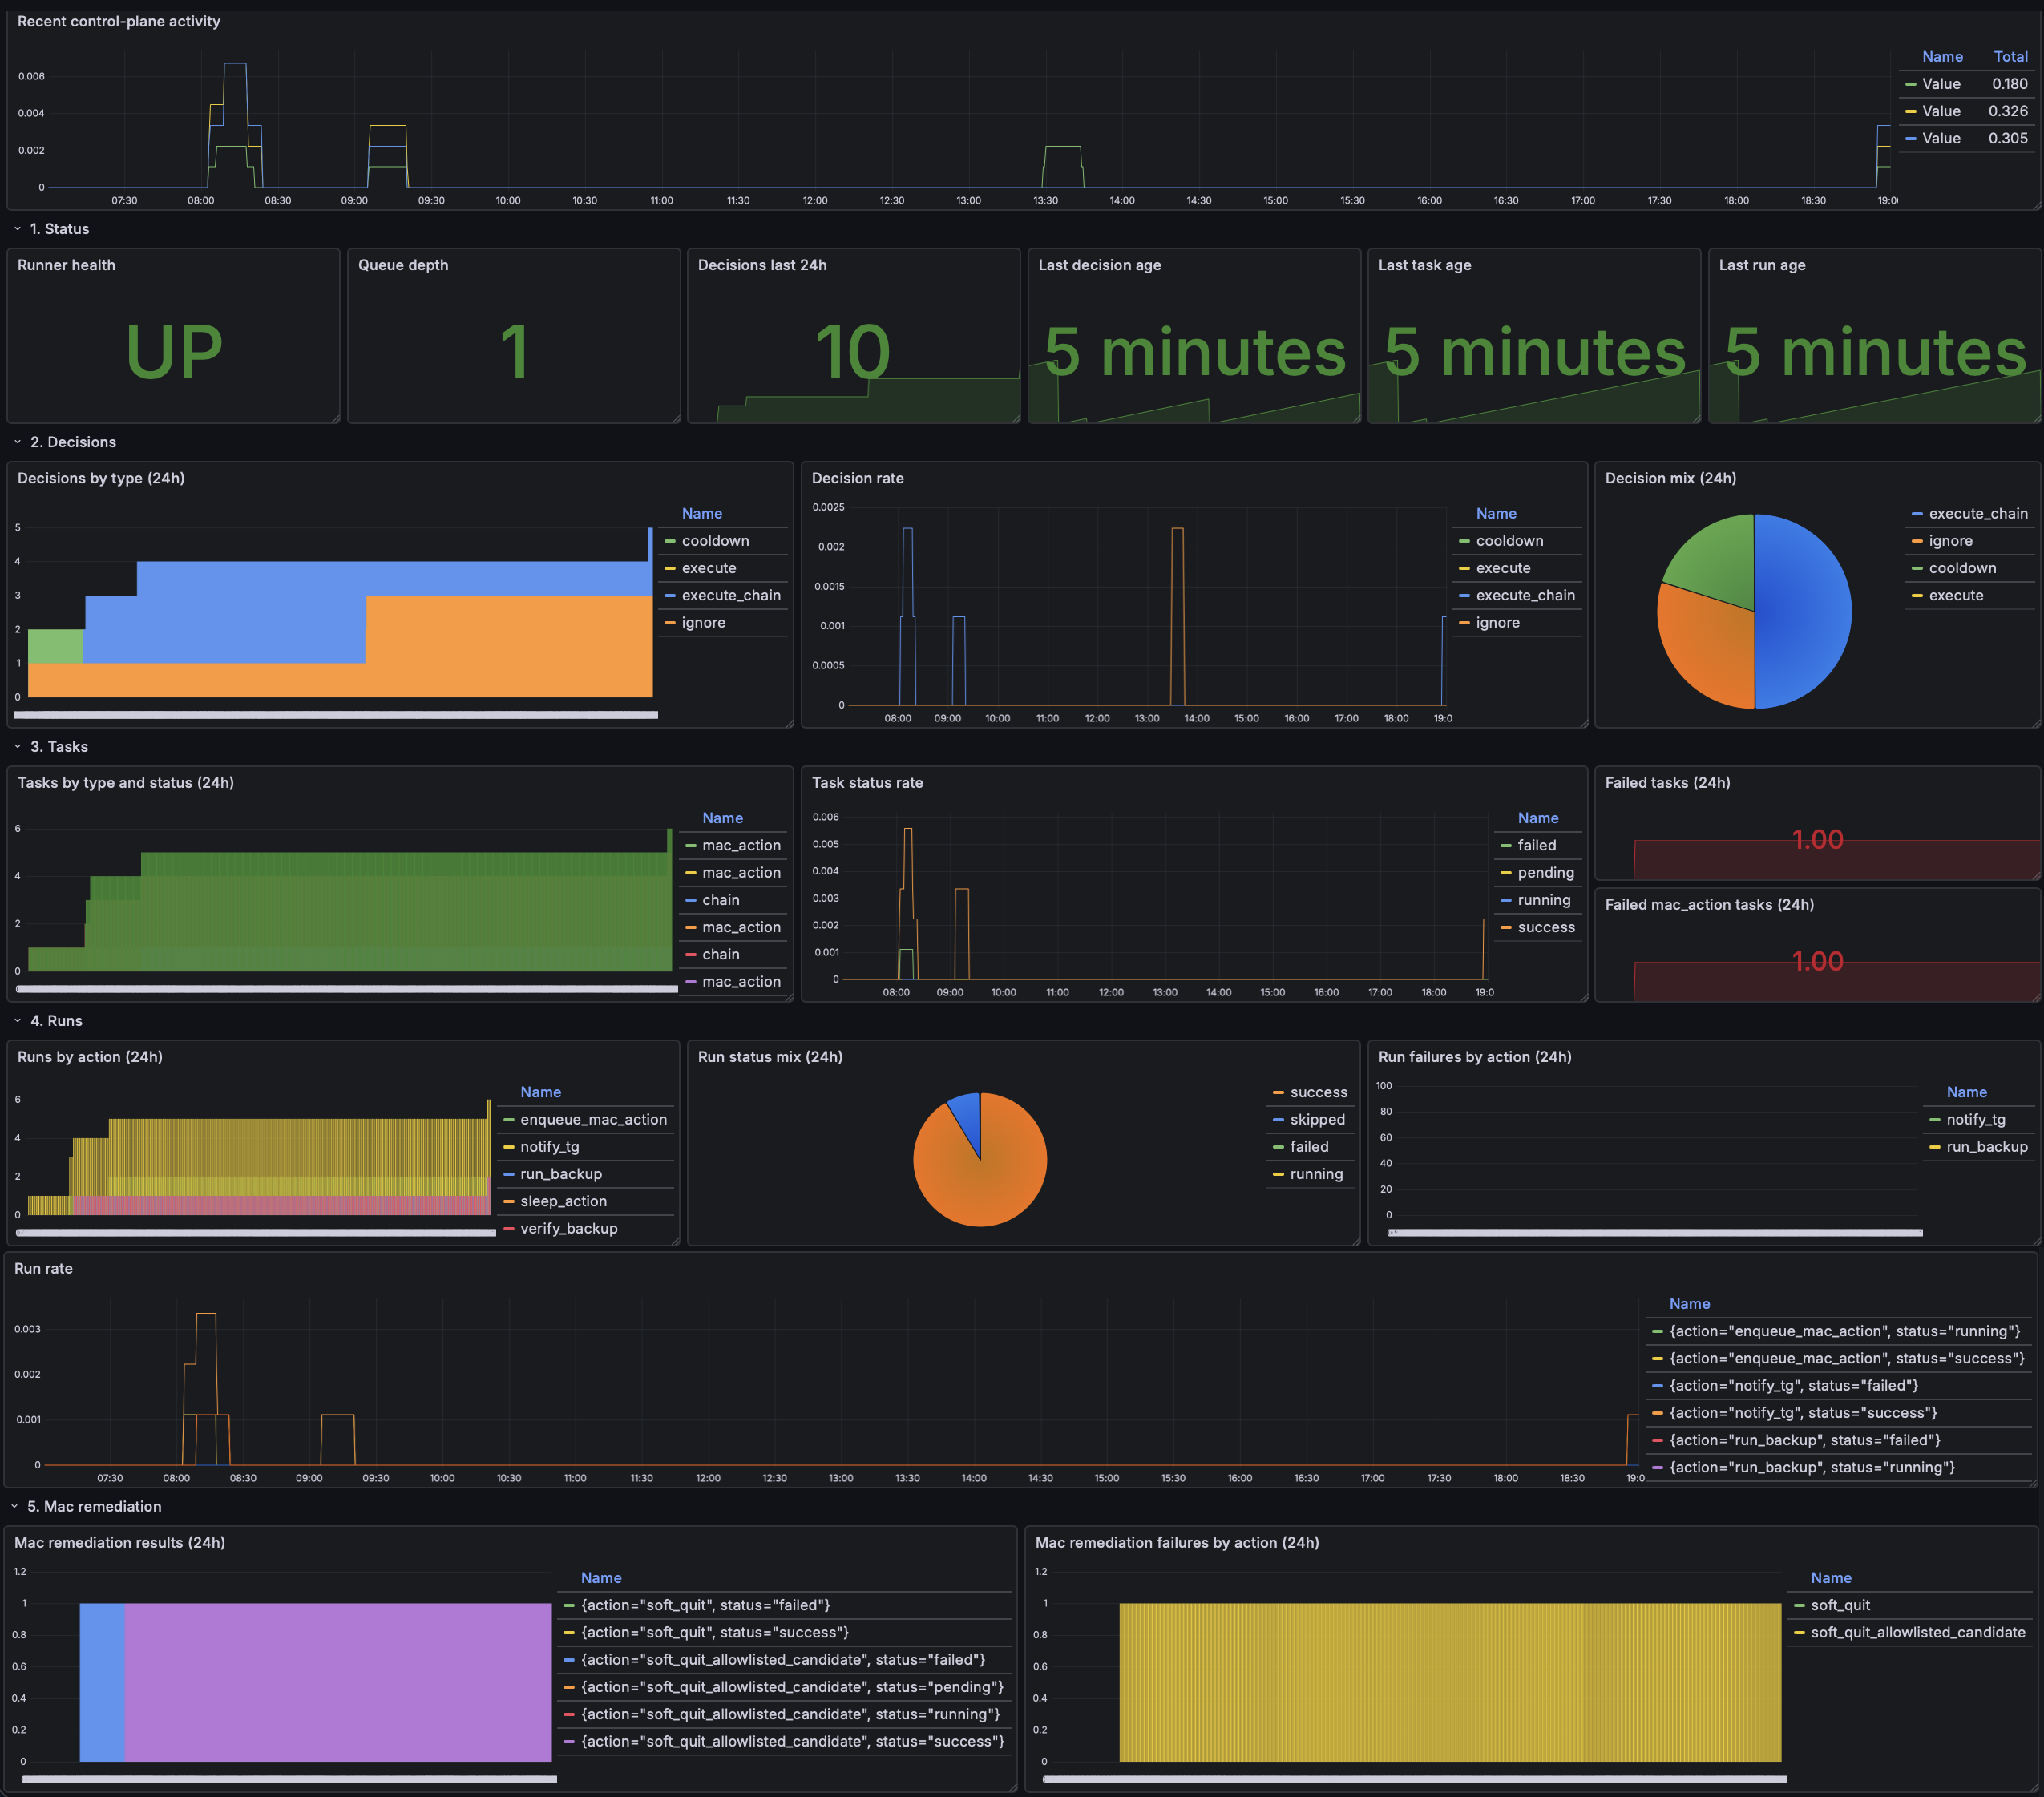
Best starting point to understand how signals move through decisions, queued work, action runs, notifications, chains, and remote Mac remediation outcomes.

Mac Host Audit

Mac audit posture, memory pressure, agent health, battery and backups.
featured mac audit textfile metrics
Mac Host Audit dashboard preview
Answers whether the Mac is OK, whether the local agent is alive, whether memory pressure exists, whether Time Machine is fresh, and which processes are currently consuming memory.
Grafana: Mac Host Audit

Application and alert views

Useful when validating demo traffic, SLO rules, or host-level alerting.

Demo App Observability

Traffic, errors, routes, p95 latency and inflight behavior.
featured application
Demo App Observability dashboard preview
Use together with the main demo page. Shows how manual traffic generation changes request rate, error distribution, latency, and service health.

Application Alerts

Demo-app health, 5xx, p95 latency and inflight requests.
alerts app SLOs
Application alerts dashboard preview
Focused alert-oriented view for the demo app. Useful when checking whether traffic spikes become warning or critical conditions.
Grafana: Application Alerts

Host Alerts

Node exporter health, reboot age, root filesystem, CPU and memory.
alerts infrastructure
Host alerts dashboard preview
Infrastructure-focused dashboard for admin and VPS nodes. Good for reboot detection, disk pressure, node exporter status, and quick host-level health validation.
Grafana: Host Alerts
Static previews only. Live Grafana links are intentionally omitted from this public surface.